Mapping Your Future Home: Essential Tools for Evaluating Neighborhoods Before Buying
It took us two years to find and purchase our home on Long Island in early 2022. We watched as COVID caused a great deal of fluctuation in mortgage rates and supply. Now that we’re settled, I figured I could share the tools I used to find a home that will *hopefully* save us money in the long run with lower taxes, risk and higher appreciation. Some of these resources apply to anyone looking to rent as well
I typically recommend using your local MLS as the site for searching for homes. By now, most of them have mapping tools to draw areas of interest, notifications about new listings and changes, as well as more filters like property taxes, acreage, school district, etc. On Long Island, the MLS is OneKeyMLS (https://onekeymls.com/). However, recently, the option to filter by property tax was removed, so I no longer recommend it.
Instead, Redfin (https://www.redfin.com/) seems to have the most filters I’ve found on any other property search site, including an option for filtering by max property tax. You can also select multiple counties, towns or school districts. In addition, you can exclude 55+ communities and land leases, as well as filter by GreatSchools and WalkScore ratings. Be mindful that there is always the risk of these filters being incomplete, so I tend to only use these as a guide for finding areas I’m interested in. Then, I set alerts for the areas I am interested in with price and building type as the only filters.
Below is a collection of tools that identify the things you cannot change about a home. Sure, a home you find might have a window that’s stuck closed – you can fix that. What does it look like to live there during rush hour, during severe storms? What does it look like to raise a family there? Or where will you be able to have some fun?
Potential Dealbreakers:
- Flood Maps – Use this national viewer from FEMA to see if a property is in a flood zone. Being in one of these zones might have a direct impact on your monthly insurance rates and increases your chance of damage during a storm.
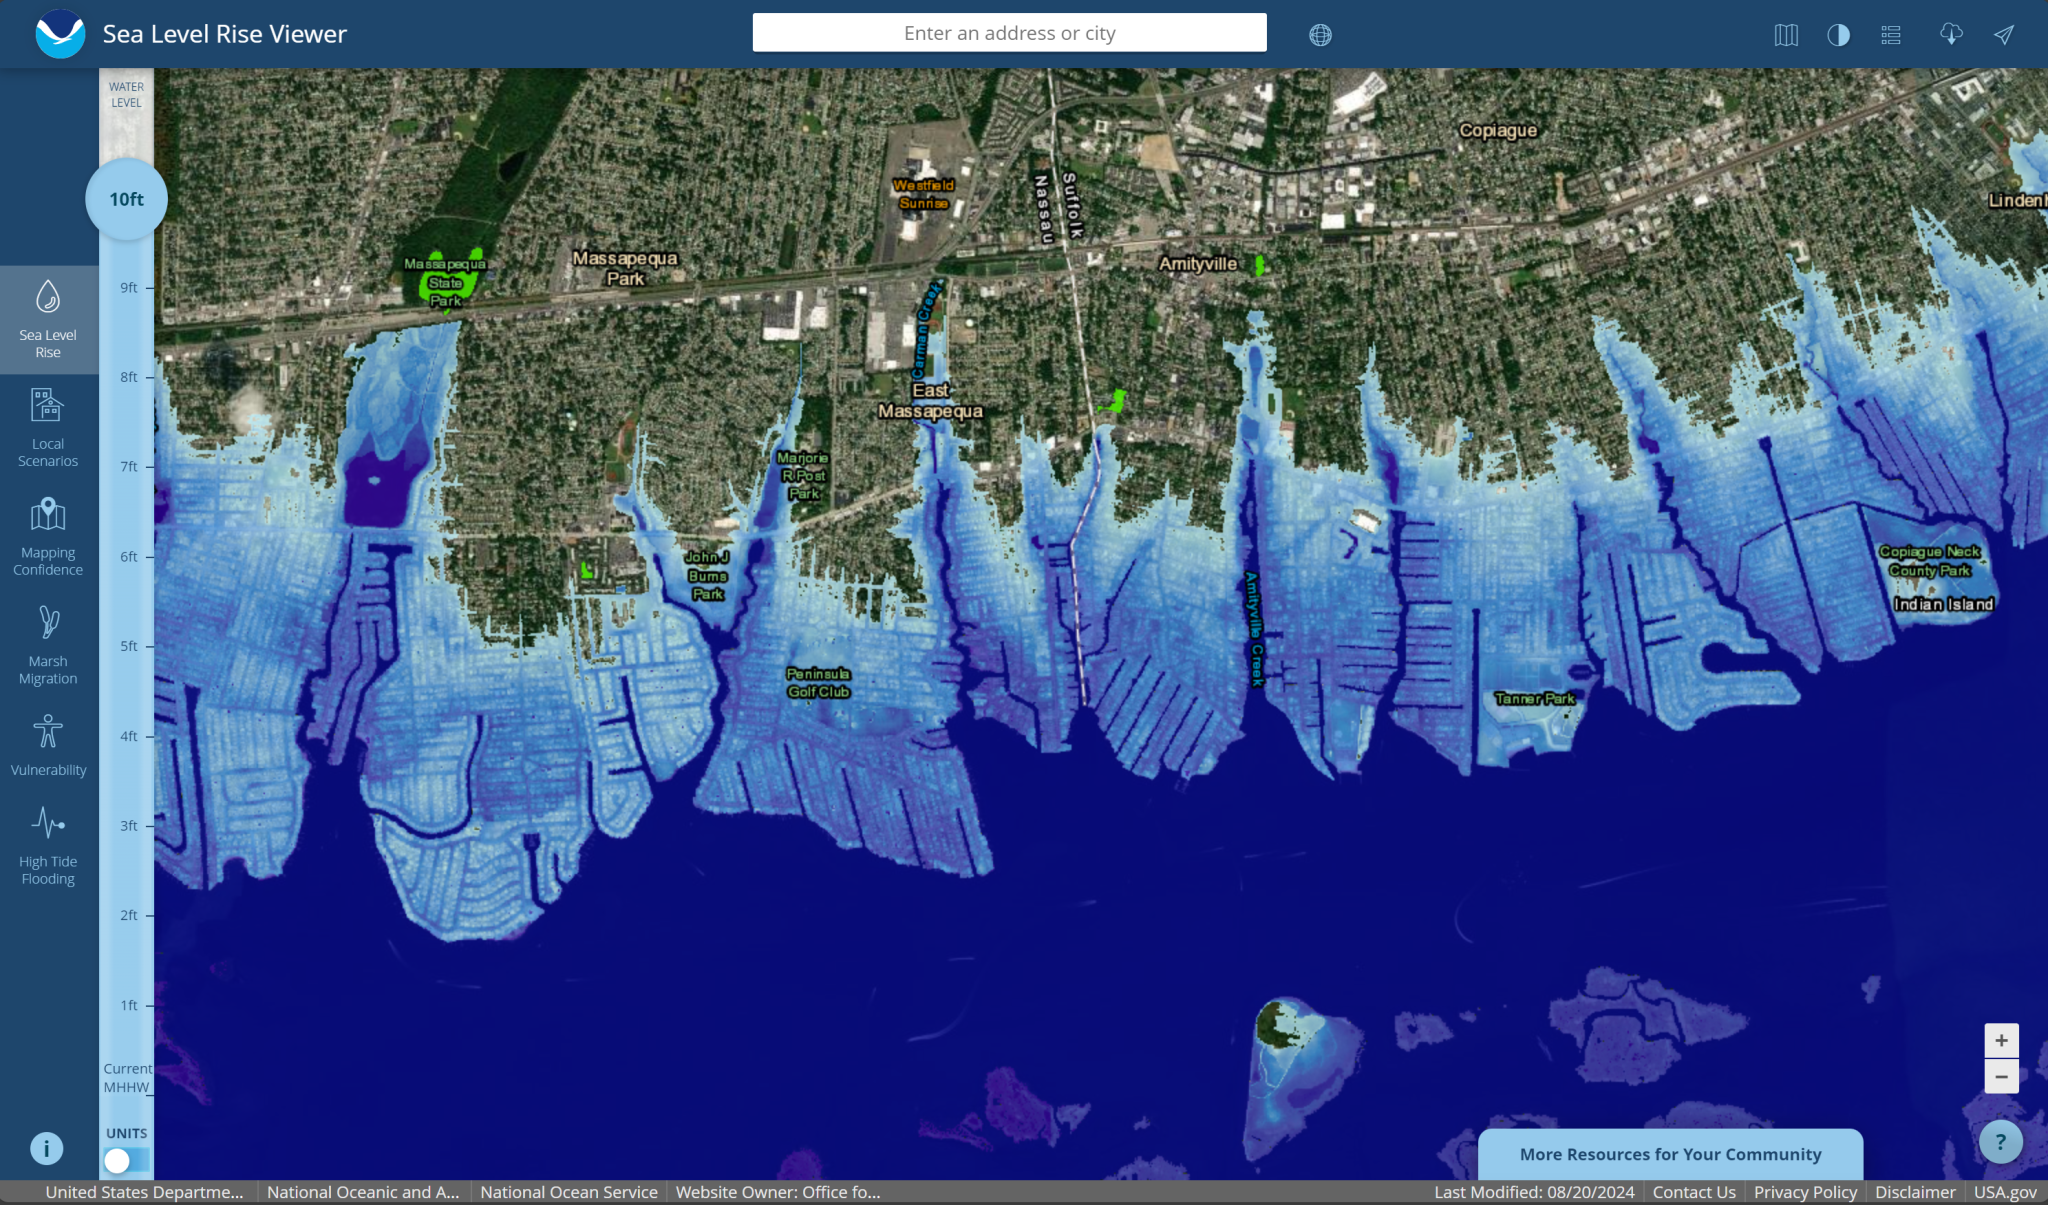
- Sea Level Rise – Use this national viewer from NOAA to show how a property might be impacted by rising sea levels. Being in an area not currently shown as a flood zone might still dissuade future buyers from being interested in your home, and this could be an indicator for where water damage is more likely to occur during a fluke storm. You can toggle the sea level rise on the right sidebar.
- SLOSH Map – Use this national viewer from NOAA to see how various category hurricanes would impact the property. You can adjust the category on the top of the page. The northeast currently does not have data for category 5 hurricanes.
https://experience.arcgis.com/experience/203f772571cb48b1b8b50fdcc3272e2c
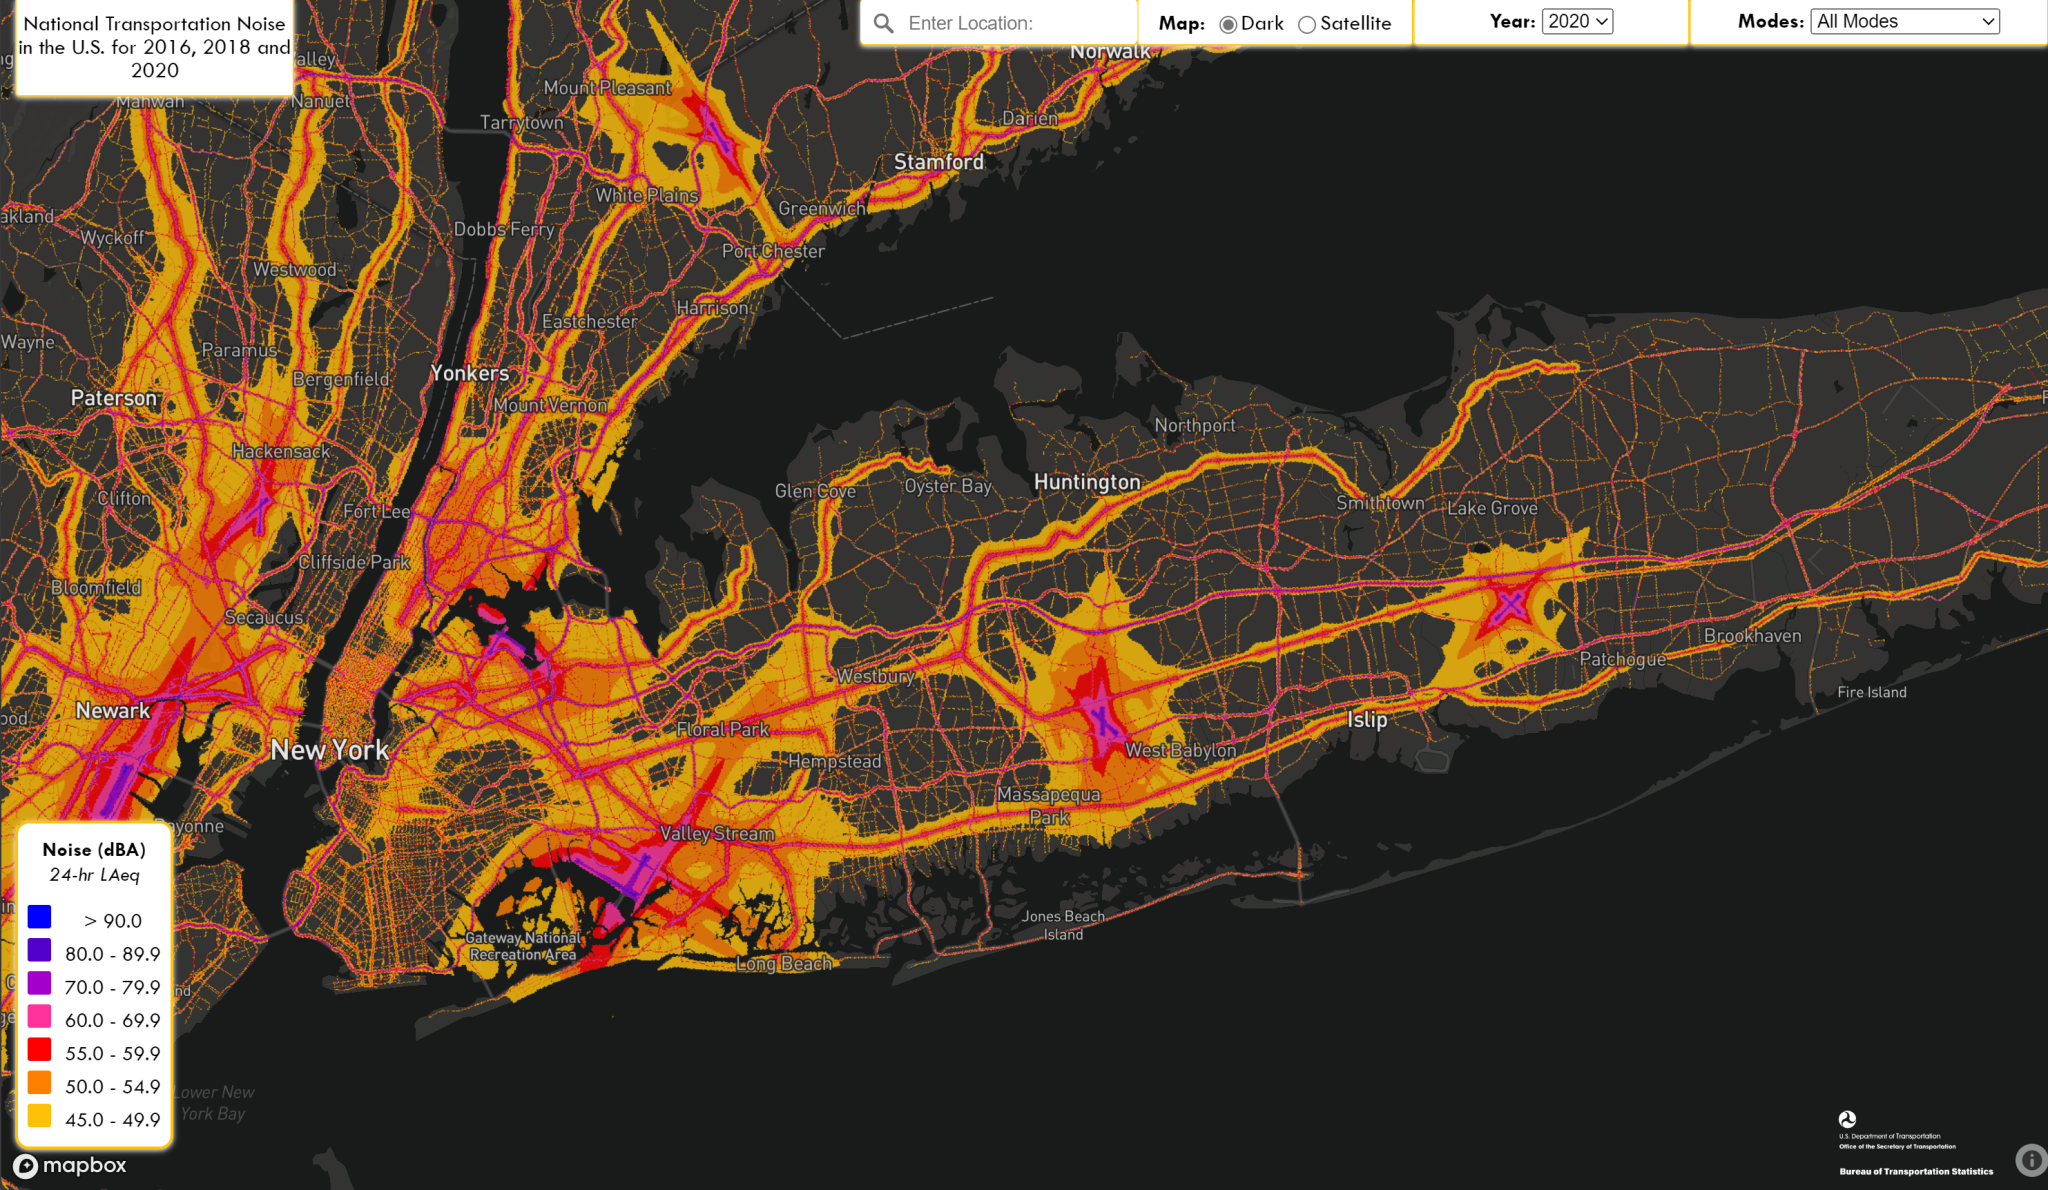
- Noise Map – Use this national viewer from the US DOT to see the nearby noise levels from roads, air and rail. You can toggle “all modes” on the top right to see everything at once.
https://maps.dot.gov/BTS/NationalTransportationNoiseMap
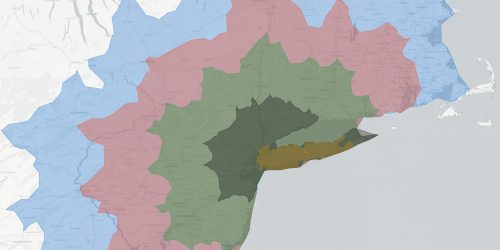
- TravelTime – Use this global viewer to see generally how far you can travel in 5 to 120 minutes by walking, biking, public transportation, driving and even driving + train. Do not underestimate how important these figures are. Time is valuable! Note that the public transit and train options might not work in all areas of the country, so you may have to look up your local public transit agencies to see if they have any trip planners.
- Environmental Risks – Use the below sites to learn about environmental risks near the properties you’re interested in. Living near these sites could have long term heath impacts, or not. It’s tough to tell because every situation is unique. On Long Island, environmental disasters have the potential to impact drinking water in aquifers below the ground, forming plumes that could travel in any direction from the site. You can specifically look up the details of each superfund site once you have the location.
- National Superfund Sites: https://epa.maps.arcgis.com/apps/webappviewer/index.html?id=33cebcdfdd1b4c3a8b51d416956c41f1
- New York DEC Environmental Remediation Sites Map: https://data.ny.gov/Energy-Environment/Environmental-Remediation-Sites-Map/jvqh-m7fz
- US EPA’s EJScreen Tool: https://ejscreen.epa.gov/mapper/
- US EPA’s EnviroAtlas: https://enviroatlas.epa.gov/enviroatlas/interactivemap/
- USGS’s Seismic Activity Map: https://www.usgs.gov/programs/earthquake-hazards/science/introduction-national-seismic-hazard-maps
- US EPA’s Radon Map: https://www.epa.gov/system/files/documents/2024-05/radon-zones-map_text_link.pdf
- Airthings Radon Map: Note, their data is only provided by people who have one of their sensors, so the data can be misleading or incomplete, but it’s still worth adding since it goes beyond the US – https://radonmap.com/
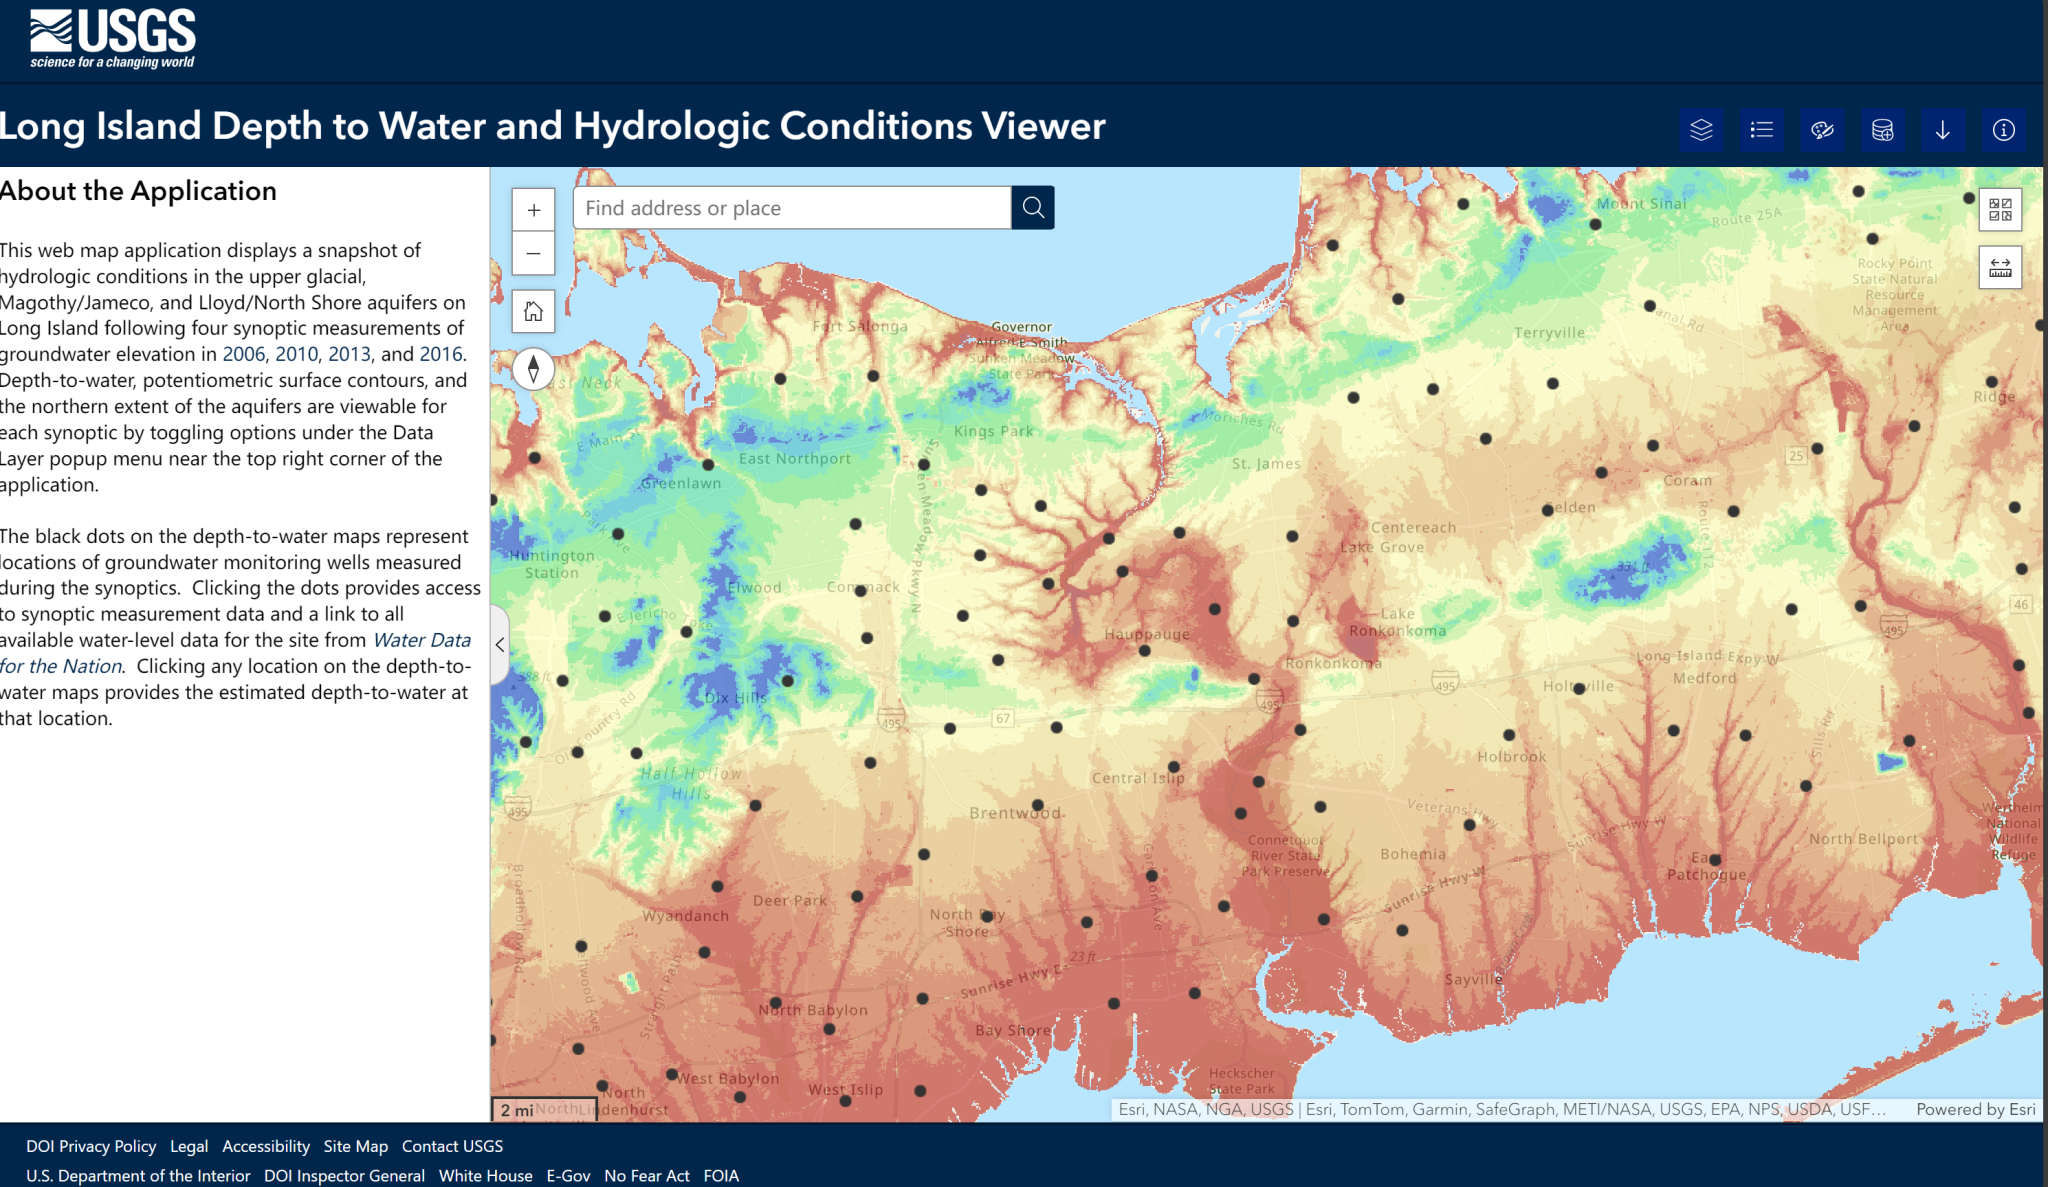
- Long Island, NY Specific: USGS Depth to Groundwater – Use this map viewer to determine if the property is likely to be inundated with water during a flood event or with rising sea levels. This tool is useful for identifying land that might be seasonally flooded or only during a fluke storm. It could also predict basement flooding or high moisture environments if the depth to groundwater is low.
https://ny.water.usgs.gov/maps/li-dtw
Nearby Activities:
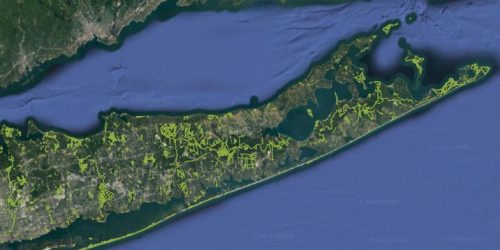
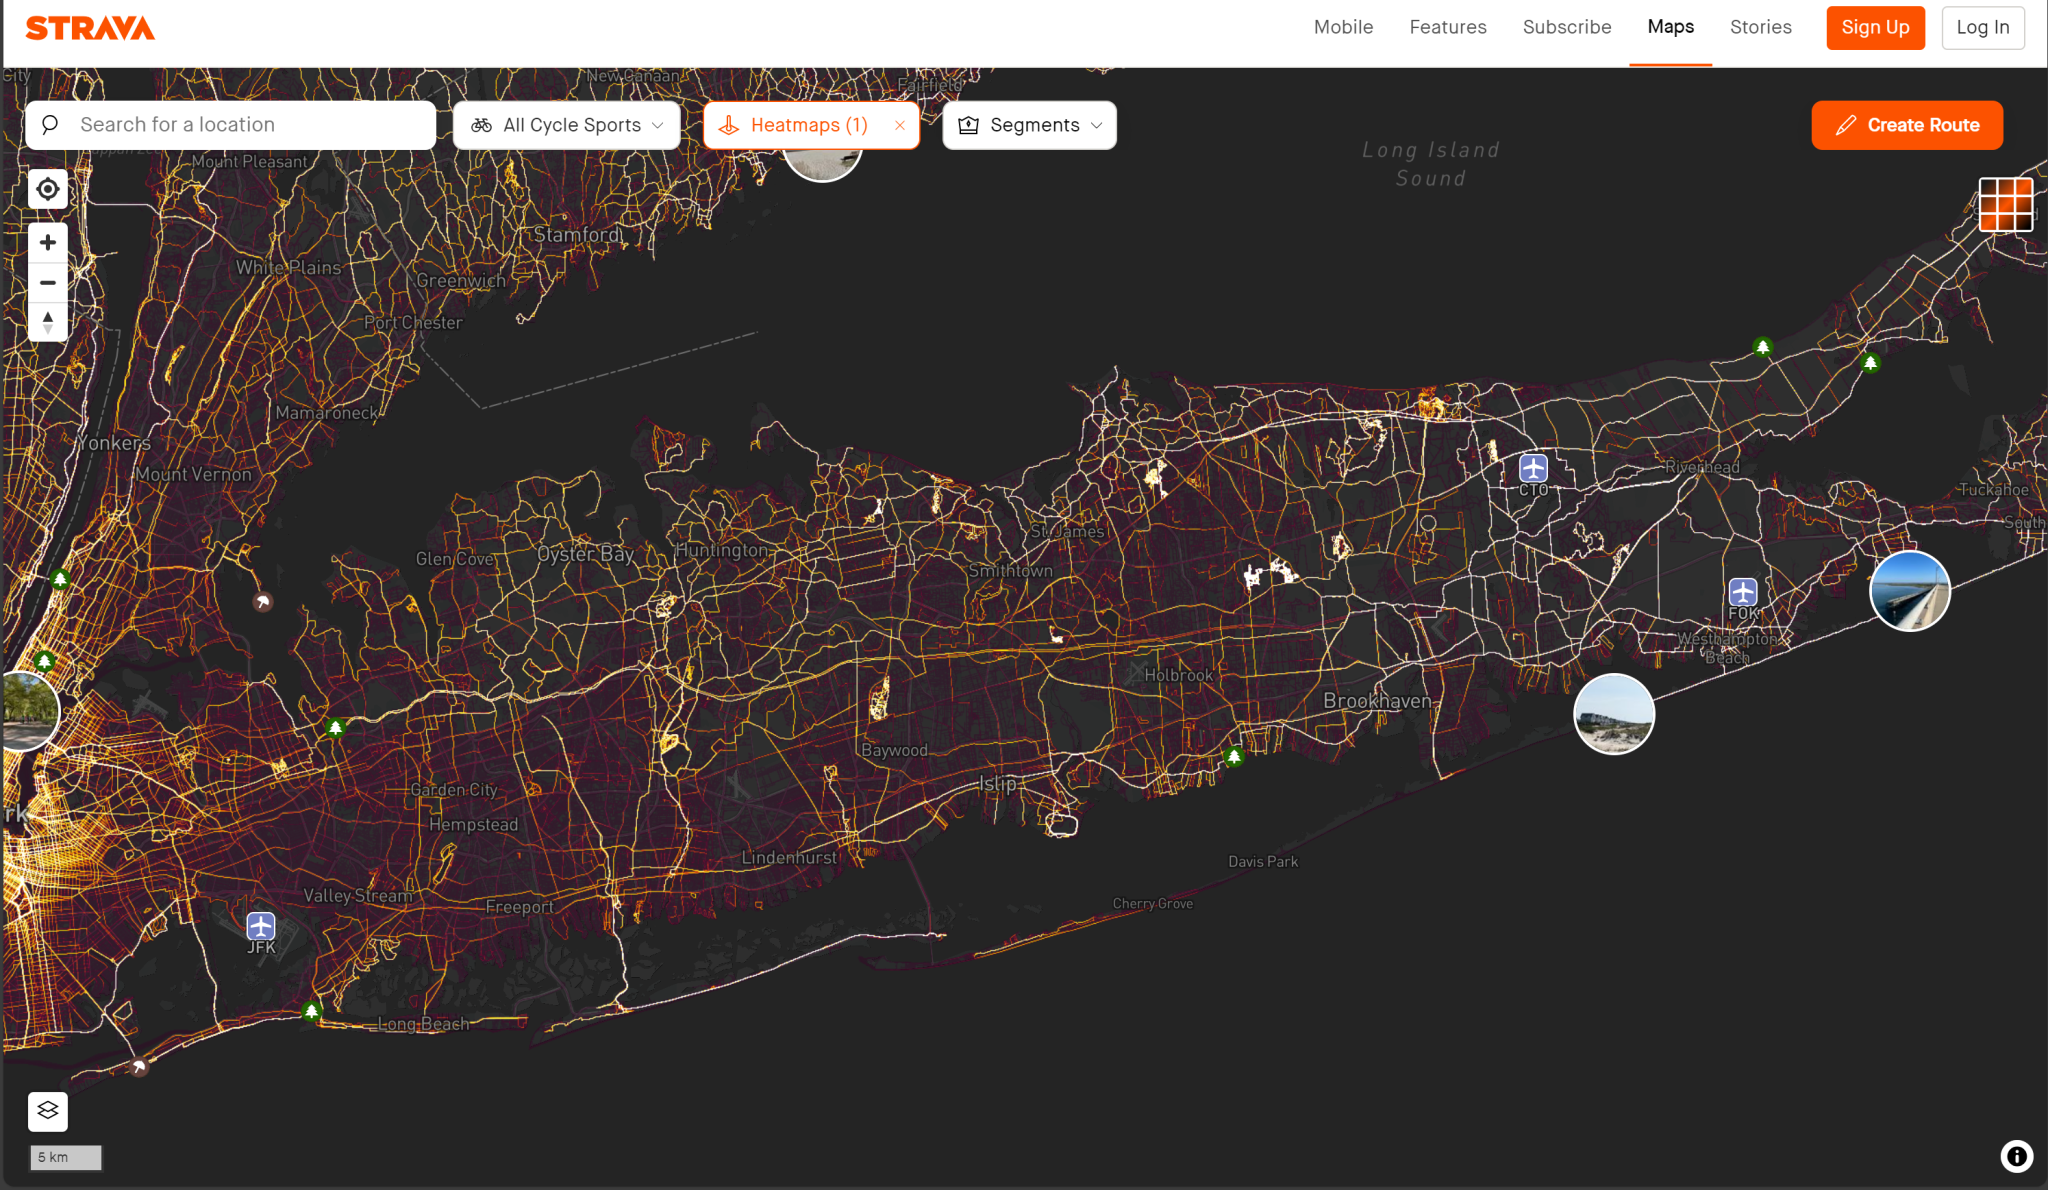
- Strava Global Heatmap – Use this global viewer to get a sense of the outdoor recreation activity near the property. You can filter by biking, hiking, walking, running and other activities. You may need to log into a Strava account to be able to zoom in close enough. Note that some areas might show no activity, but that doesn’t mean there is no opportunities for recreation. The below tools are other ways to gauge recreational opportunities nearby.
- AllTrails – Use this global viewer to find outdoor recreation activities nearby. This site has mostly been known for hiking, but it also has biking, running and other activities. You may need an account to view all the information about each location. Also, there are both curated trails that have been verified by AllTrails and ones made by the community that might be common routes around neighborhoods rather than actual destinations.
https://www.alltrails.com/explore
- Trailforks – Similarly to AllTrails, use this global viewer to see bike trails nearby. It also has other activities like hiking, running, skiing, etc.
https://www.trailforks.com/trails/map
Property Information:
- Historic Aerials – Use this national viewer to learn more about a property’s history beyond the listing photos. Look for former industrial uses, try to narrow down when the roof was last replaced, look for signs of neglect, standing water, etc. This site has a variety of years available depending on the region. There will be watermarks on the map but for these purposes, that doesn’t matter.
https://www.historicaerials.com/viewer
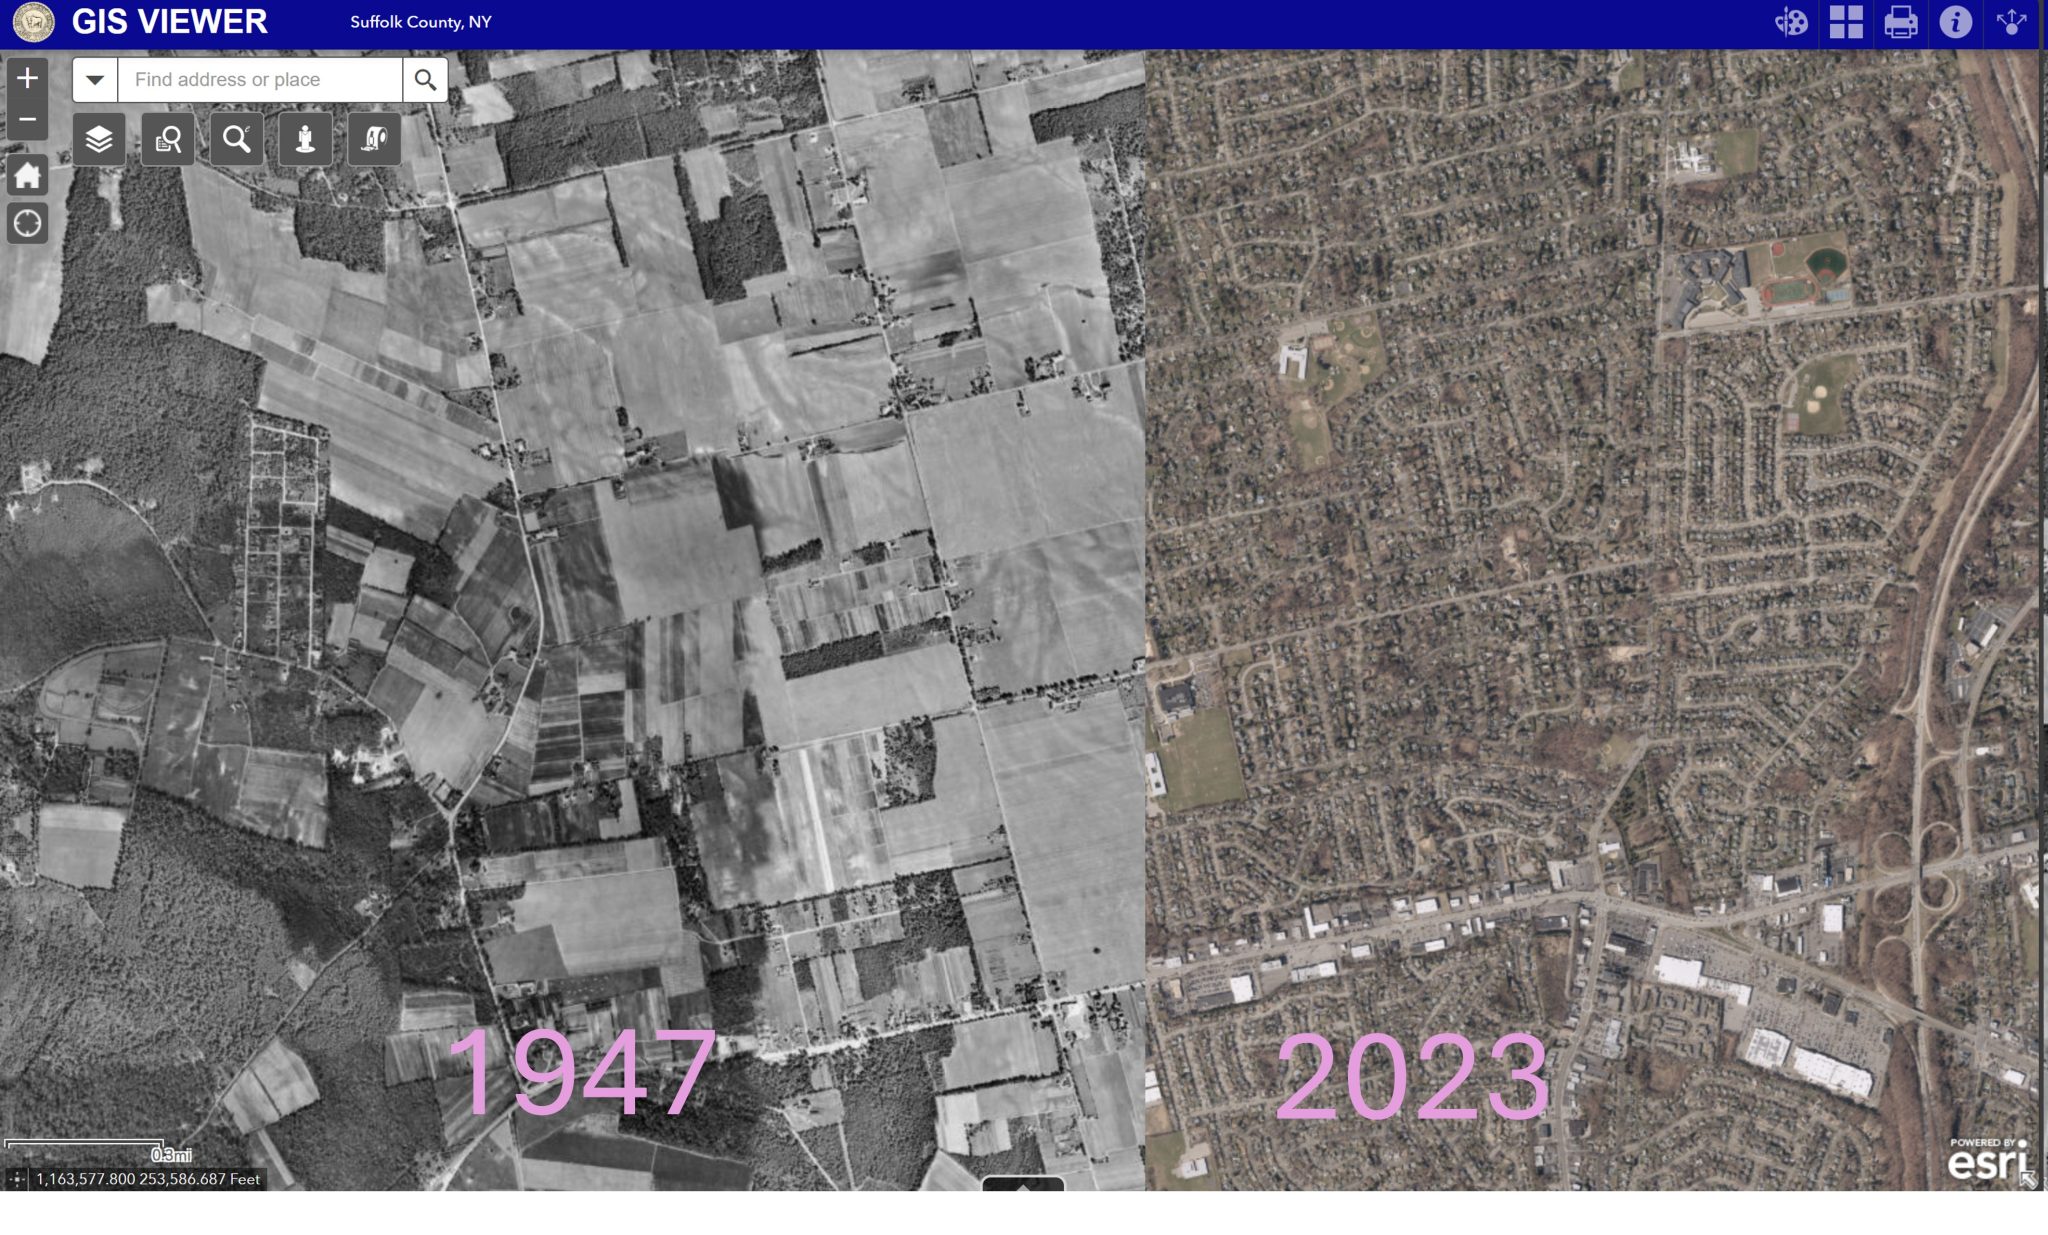
- GIS Viewers – Use these viewers to see historic aerials, and many reference layers usually related to transportation, the environment, public services, etc. This information can be useful to see what the property was before it was a house, if anything. To find them, search for your local municipality, county or state geographic information system (GIS) map viewers. For example, Suffolk County, NY has a GIS Viewer where you can view old aerials back to 1947. NYC’s viewer goes all the way back to 1924. Below are several options ranging from local municipalities, to cities, counties and globally.
- Suffolk County, NY: https://gisapps.suffolkcountyny.gov/gisviewer/
- Nassau County, NY: https://lrv.nassaucountyny.gov/map/
- New York City, NY: https://experience.arcgis.com/experience/d826b115c87841d491c2b41fcb175305/page/Map-Explorer/
- Global (ESRI’s World Imagery Wayback) Viewer: https://livingatlas.arcgis.com/wayback/
- Street View – Use these global 360 viewers to see beyond the rosy listing photos and to get a real idea of what it looks like on the ground. There are a variety of services including Google Street View, Google Earth and Bing Streetside. Links to more are available below. Each of these usually have a button for viewing past imagery. Similarly, Google Earth Pro has several historic aerials available for viewing.
- Google Street View: https://www.google.com/maps
- Bing Streetside: https://www.bing.com/maps
- Google Earth Pro: https://www.google.com/earth/about/versions/
- Wikipedia Listing for Other Services: https://en.wikipedia.org/wiki/List_of_street_view_services
- Tax Portals/Assessment Rolls – Use these websites to find out the property’s true taxes without any of the current owner’s potential discounts. You can also view the taxes of nearby lots to gauge if the property you’re interested in is paying more or less than similar neighboring properties. Some of these sites are map based and will also have additional reference layers and aerials available. Smaller municipalities might only have a PDF assessment roll document available. Below are some examples local to Long Island, NY.
- Brookhaven Town, NY: https://gis.brookhavenny.gov/arcgis/apps/webappviewer/index.html?id=37287bd1c0f24b6d81f06ecfccf34836
- Southampton Town, NY: https://gis.southamptontownny.gov/infocenter/
- Huntington Town, NY: (Click Property Card) https://huntingtonny.gov/taxlookup
- Town of Babylon, NY: https://property.townofbabylon.com/
Neighborhood Information:
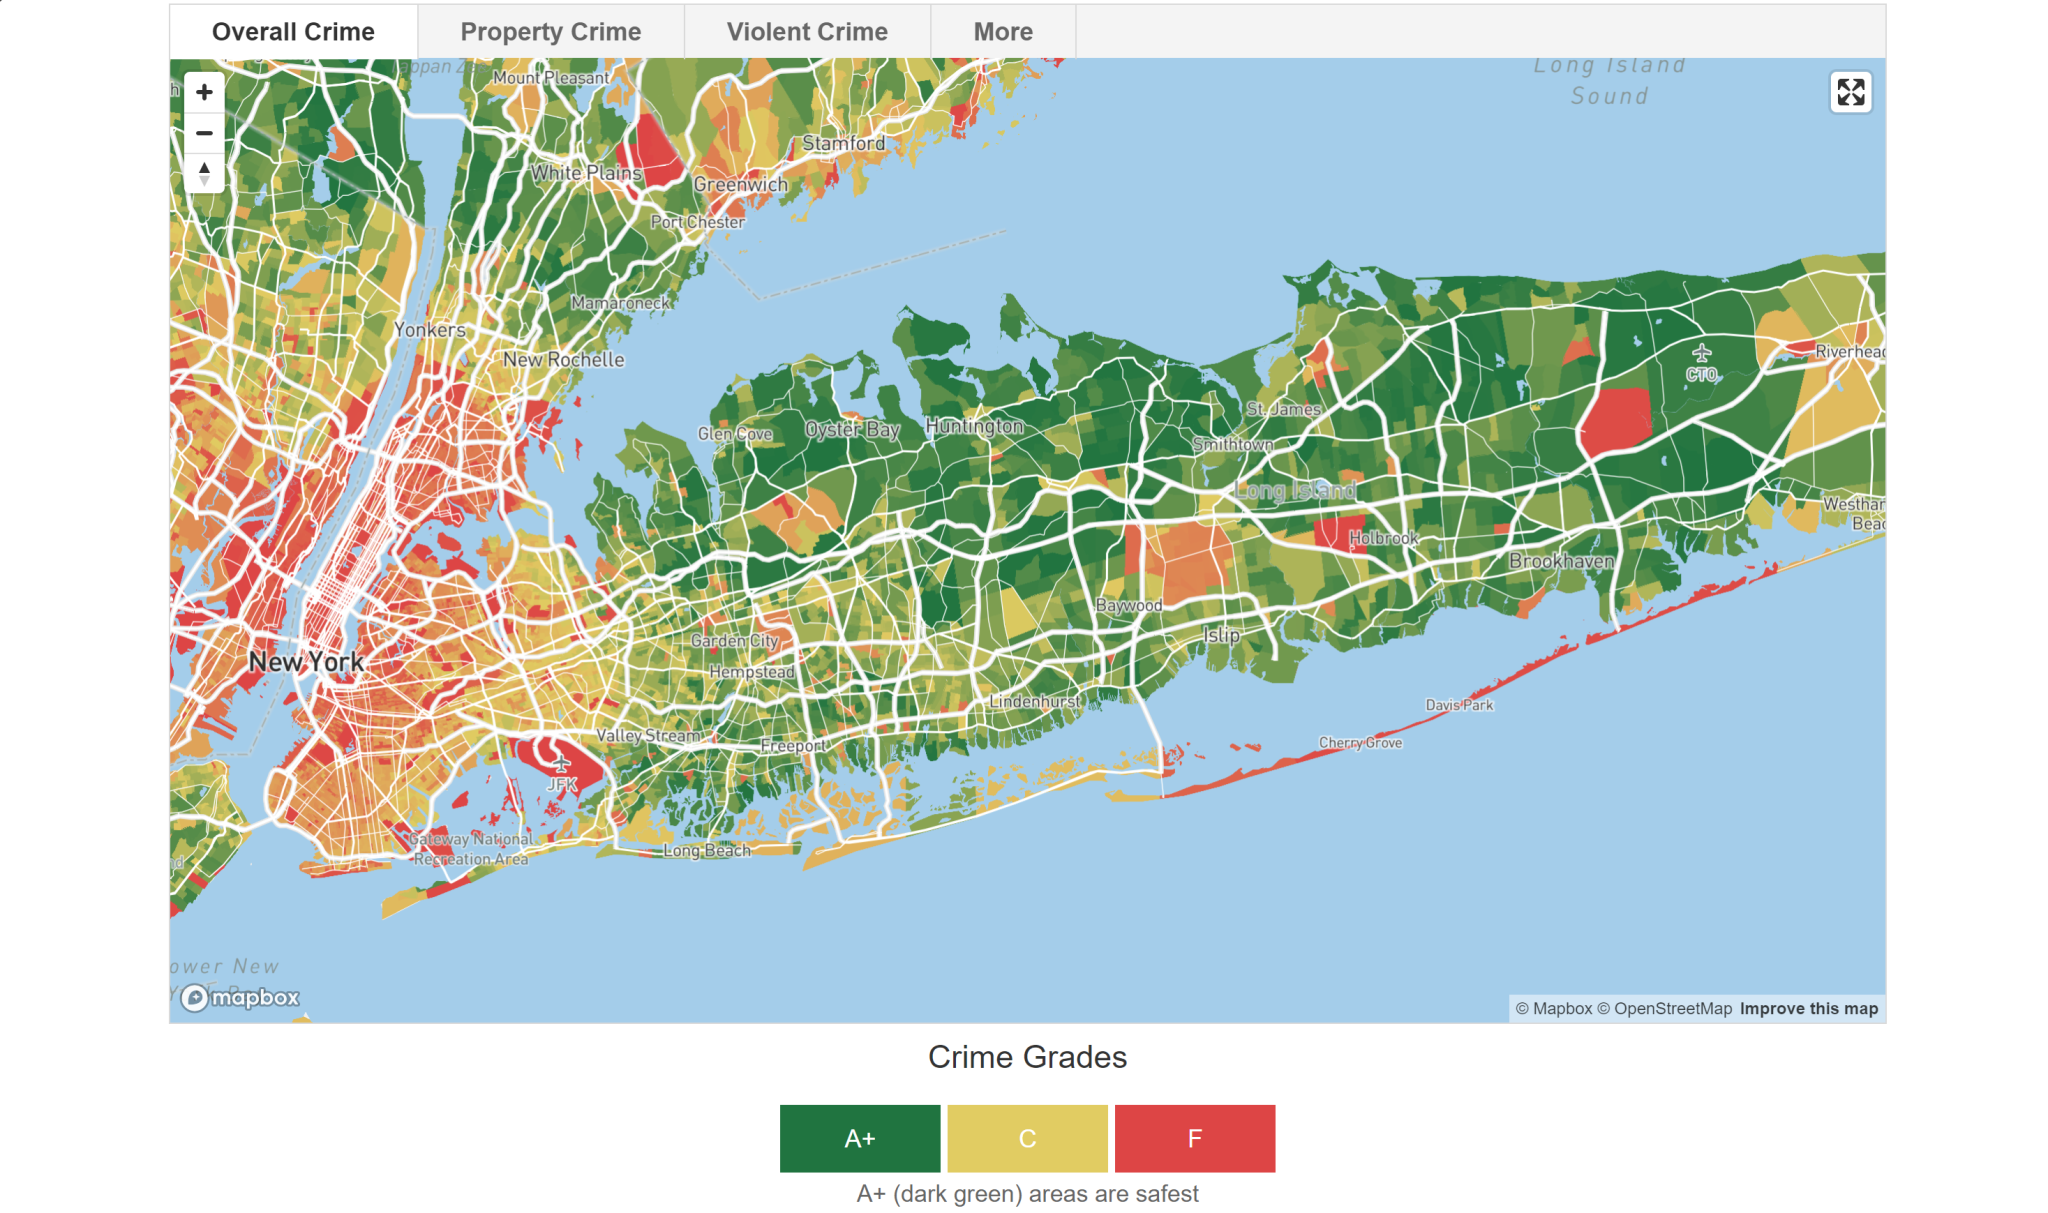
- Rating Sites – While these websites can be useful for gauging the vibe of an area, do not put too much weight on them. The data can be incomplete, and they might have ulterior motives for making you feel like the area is unsafe, undesirable, or that the school is bad. Ratings might also be artificially distinguishing neighborhoods or schools that are, in reality, very similar in performance statistics. There are several sites that offer ratings, but I will provide a few below:
- CrimeGrade: https://crimegrade.org/ (Shown below. Most of NYC is labelled “high crime”)
- AreaVibes: https://www.areavibes.com/
- Niche: https://www.niche.com/
- GreatSchools: https://www.greatschools.org/
- Niche: https://www.niche.com/
- SchoolDigger: https://www.schooldigger.com/
- US News: https://www.usnews.com/education/k12
- NeighborhoodScout https://www.neighborhoodscout.com/
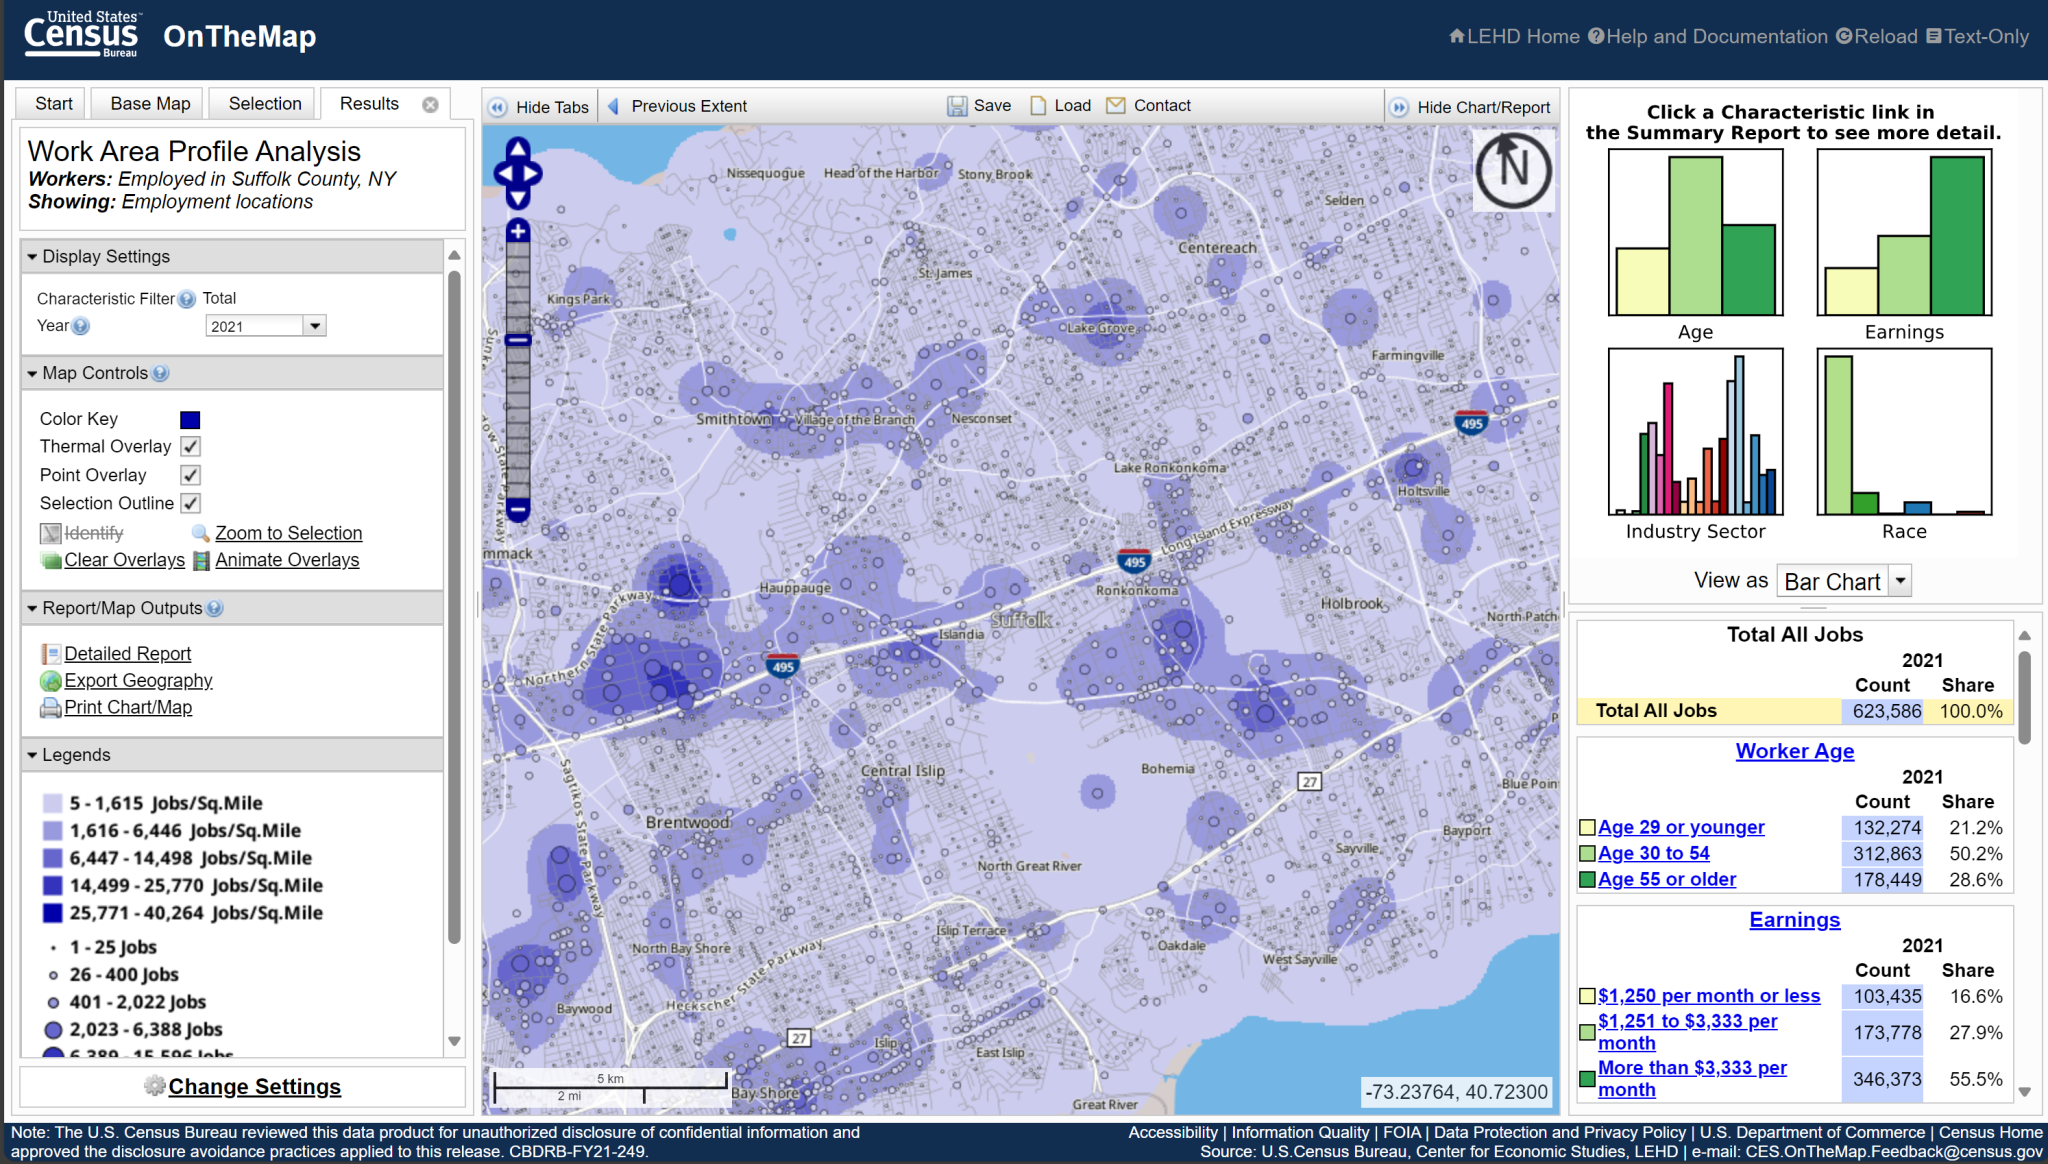
- Job Availability – The Census has a nice map that can show job density clusters. However, it is a little clunky, so to use it, visit the site below. Go to the Selection tab on the left sidebar. Under “Add Layer Selection”, choose “Counties”. Zoom to the County of interest and select “Draw Points”. Place a point within the County of interest, and then choose “Confirm Selection” on the left sidebar. Finally, choose “Perform Analysis on Selection Area”. On the right side of the popup, change the settings to “All Workers” and click Go. Now, you’ll see a heatmap of all the job centers within the County.
https://onthemap.ces.census.gov
- Demographics – If you’re moving somewhere new, a look at the demographics, economics, policies, incomes, and other data might be a worthwhile exercise. While you can certainly go to the Census website for a whole slew of demographic data, I found their site generally hard to use. Policy Map, while it is partially behind a paywall, offers dozens of layers for the entire US that are very quick to look through. Choose “enter without logging in” when you navigate to the site. I recommend looking at the following layers first:
- Population Density
- Diversity Index
- Median Age
- Owner Occupied Housing
- Religion
- Per Capita Income
- Poverty Rates
- Location Affordability
- Property Tax
- Residential Buildings and Quality
- Vacancy
- Transportation
- Travel Time to Work
- Mode of Transportation to Work
- Life Expectancy at Birth
https://www.policymap.com/maps
Unfortunately, PolicyMap has voting history behind a paywall. While voting history is not a representation of all residents, neighbors and visitors to an area, it’s at least an indicator to take a look at. From what I can tell, this map from New York Times shows tract level data: https://www.nytimes.com/interactive/2021/upshot/2020-election-map.html
- Open Space – Use these tools to see what open space is near the property. This is important for knowing what land could be developed in the future that is currently natural land, but also for identifying recreational opportunities.
- Long Island Specific, Peconic Land Trust: https://peconiclandtrust.org/our-work/map
- New York Specific, Protected Area Database: https://www.nypad.org/InteractiveMap
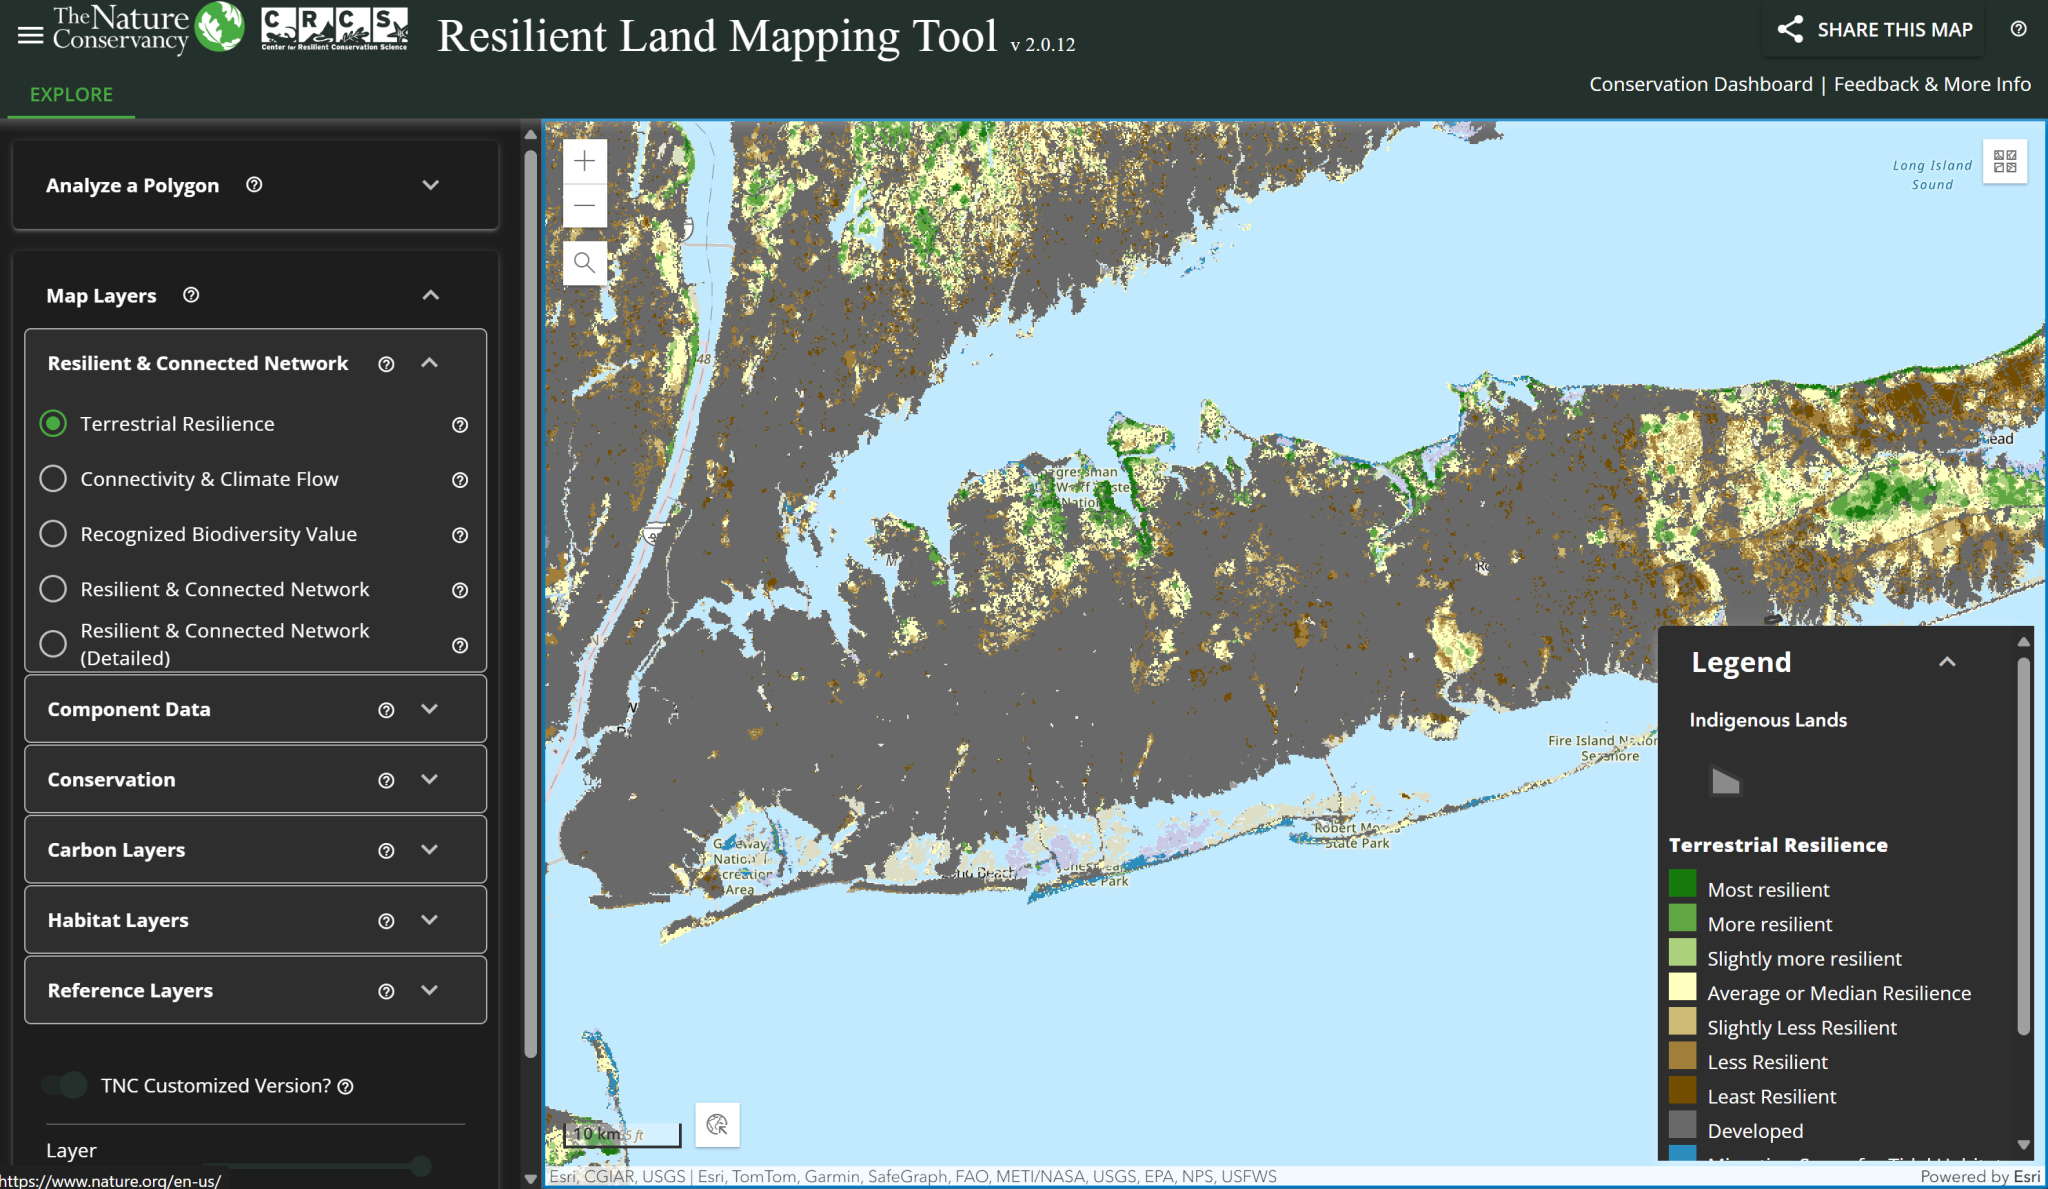
- National, Nature Conservancy: (Turn on “Secured Lands Only” unless you also want to see what areas have the strongest resiliency) https://www.maps.tnc.org/resilientland
- Commercial Activity – Use this national map to get a feeling for what kind of commercial activity is near the home. Note that this layer is from early 2020, so the stores might have closed or opened under different names, but the built environment is likely the same.
Safegraph: https://www.arcgis.com/apps/InteractiveLegend/index.html?appid=2a802a5ee9c84108a239333ab7badb81
You can also use Google Maps and search for different keywords like “Restaurants”, “Bars”, “Things to Do” or “Grocery Store” if you’re unfamiliar with the area. Find the closest restaurants and look at their reviews. Just by proximity, you will probably be eating there.
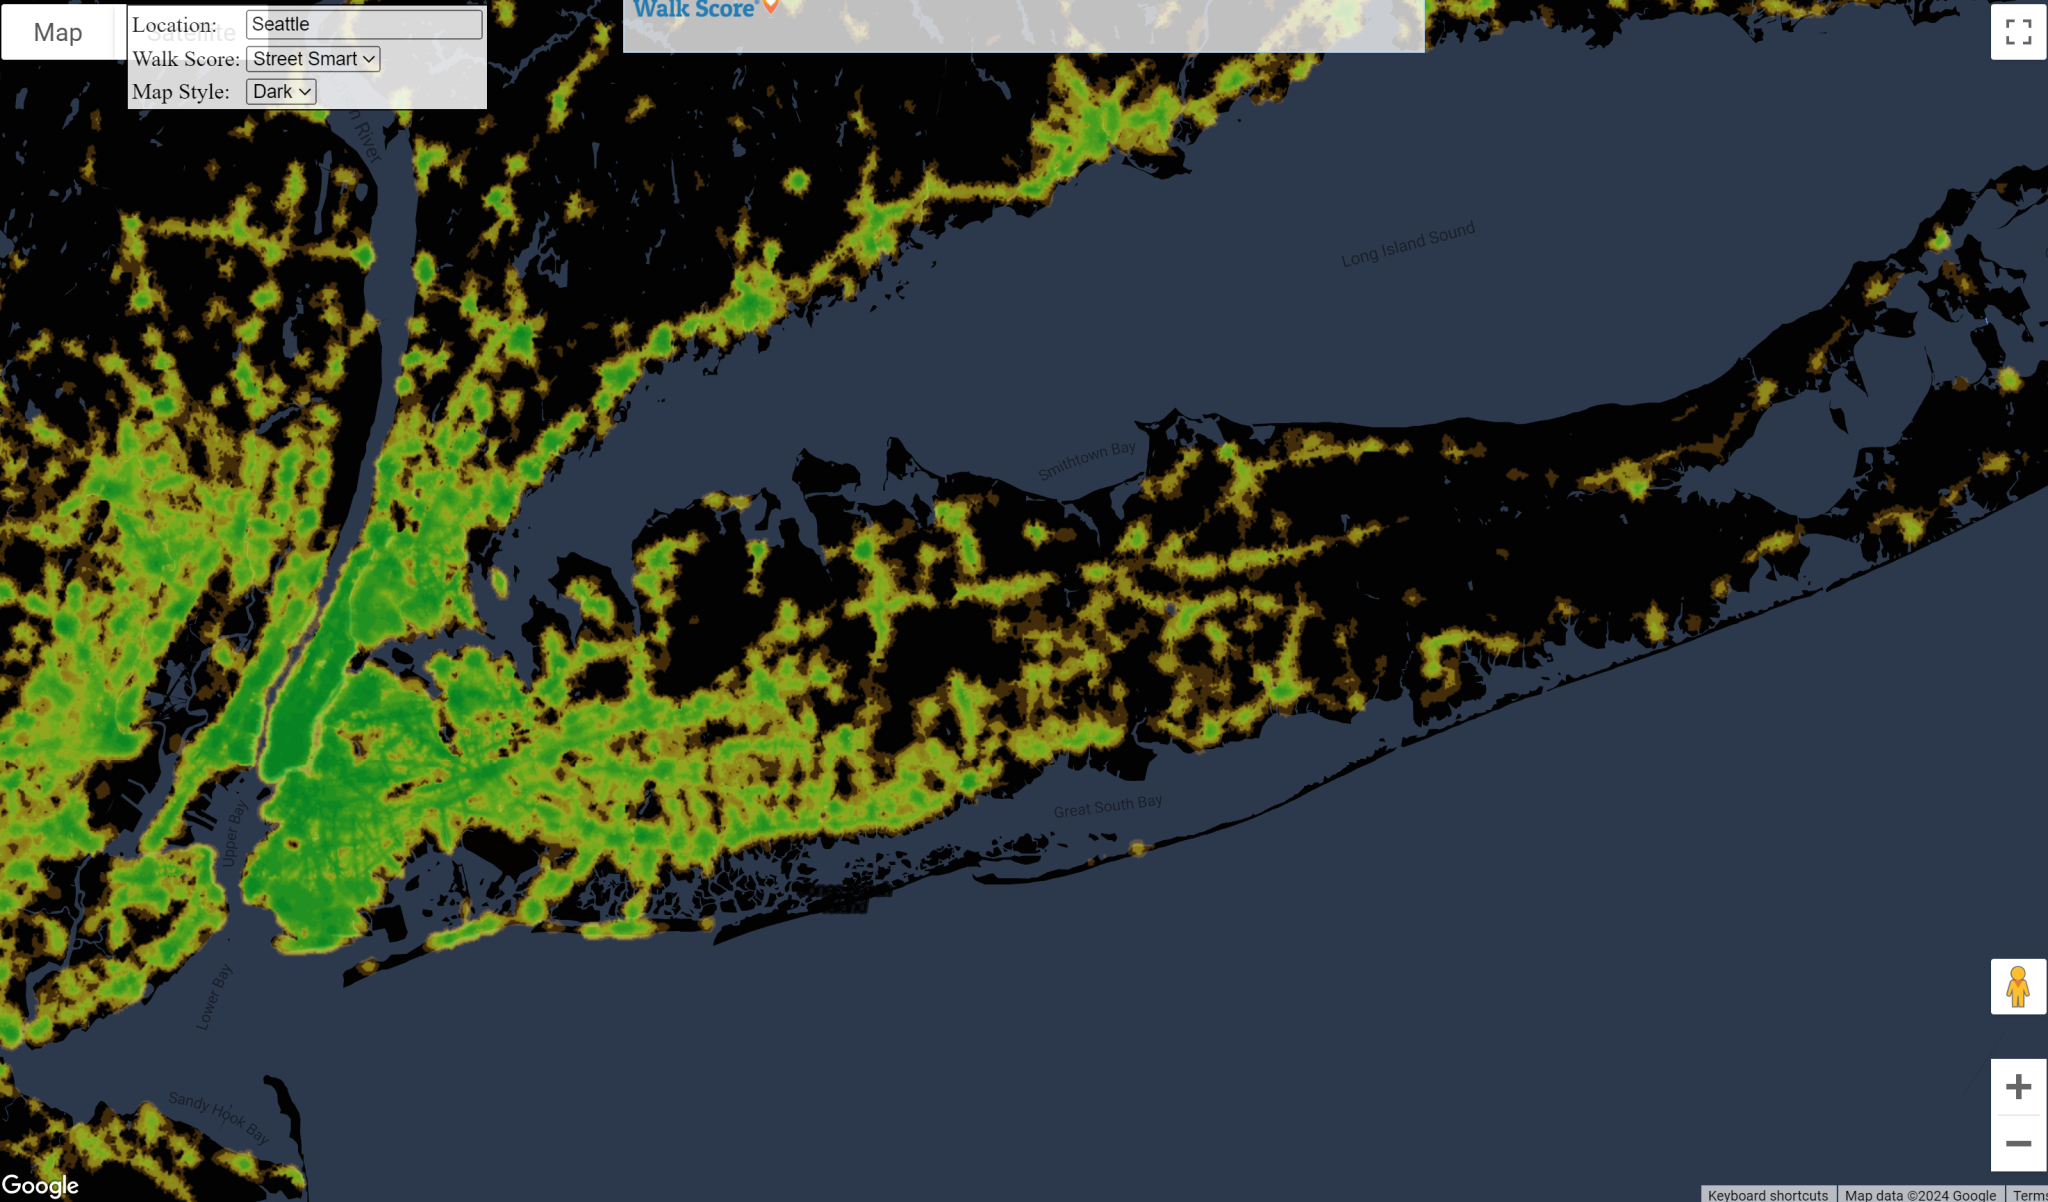
- Walkability, Bikeability and Transit Access – While Redfin includes Walk Score, Bike Score and Transit Score filters, you can visit the Walk Score site to learn more about the neighborhoods you’re interested in. Note that these resources are only as good as the data they have, so your results may vary.
- Walk Score: https://www.walkscore.com/explore
- Walk Score (more detail), Transit Score and Bike Score: https://www.walkscore.com
- AllTransit: AllTransit Metrics (cnt.org)
Another resource would be the EPA’s Smart Growth data, but all the mapping tools are down as of writing this article. I’ll still keep the link below in case it comes back:
https://www.epa.gov/smartgrowth/smart-location-mapping – in the meantime, US EPA’s EnviroAtlas has walkability data working (linked above)
- History – If you’re looking at a home that’s over 80 years old, there’s a chance it is listed on the state’s historic preservation register. That could mean restrictions when renovating. If you’re not looking at an older home, you can still use this to see where historic neighborhoods and downtowns near the property might be and learn a bit of history about the area. To use view listings, search for your state’s historic registry map.
In NY, you can use the NYS Cultural Resource Information System hit Agree, “sign in as guest” and then select search. Then you can toggle more layers on the top row of icons within the map.
Another national historic resource is the USGS Topographic Map viewer. Zoom to the area of interest and select the oldest applicable map. Older maps identified individual homes, major businesses and geographic features.
https://ngmdb.usgs.gov/topoview/viewer
Other Suggested Searches:
- Find out what annual events the local chamber of commerce or other local group holds each year. Check out the local papers to see what the local buzz is.
- Search the street name and town name to see if there have been any news articles involving the street or property. You might need to write with quotations, plus or minus signs to get the right results. I’ve had success writing the word crime or patch in there, too.
- Look to local Facebook groups, Reddit and CityData forums (https://www.city-data.com/forum/) to answer questions you might have.
- Double-check the sales history of the property. Most real estate sites will have this information towards the bottom of the listing. In particular, see if people only stay a short time or if the homeowners tended to stay 10+ years. Or, if the property has been flipped in a short time span. That might be a good indication that shoddy work was done.
- Don’t skip the inspection… It’s like $500-600 for peace of mind and even in a seller’s market, we were able to get about $2,000 towards a new furnace.
- Look into first time homebuyer programs. On Long Island, Suffolk County has its own grant program, and New York State runs SONYMA, which also offers neighborhood revitalization grants. We were able to use a SONYMA grant to both cover closing costs and get our septic system replaced.
- Once you narrow down your search, get off the computer and go walk the nearest downtown, visit what would be your local bagel or pizza shop, check out the library and visit a local park. Visit the street at different times of day to see how busy it is.
This might be one of the largest purchases of your life. Do what feels right. Don’t spend too much time making sure every metric is flawless, but also don’t let someone push you towards a home that has a dealbreaker. At the end of the day, you’ll be the one living there for 1, 2, 5, 10+ years.
Disclaimer: None of the sites listed above have compensated me for including them on this list, and there are no affiliate links on this page. In fact, this site has never made me a dime!